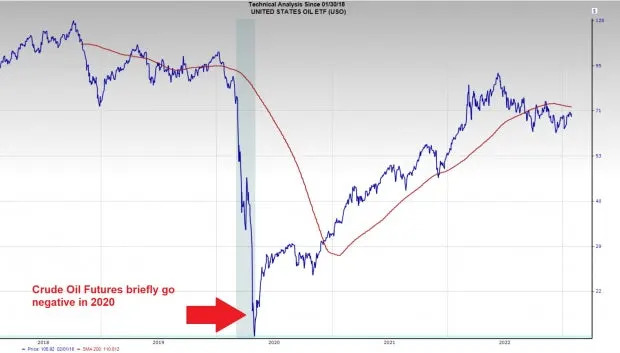
FROM ZACKS Investment Research. An Unprecedented Commodity Event. A little more than two years ago the commodity market shocked the world. In a bizarre turn of events, the price of Crude Oil went negative. Below is a chart of the United States Oil Fund ETF USO which tracks Crude Oil prices and illustrates the madness of the time:

Zacks Investment Research
What caused the event?
· Oversupply: At the time, the Trump administration was adamant on making the United States an oil exporter for the first time in decades. The unleashing of the domestic energy industry led to oversupply in the short-term.
· A Plummet in Energy Demand:While the global supply of Crude Oil was soaring, demand was cratering due to the COVID-19 pandemic. (The oil crash took place in April 2020)
· Limited Capacity: When a futures contract expires, traders can either roll their position to a different futures contract or “take delivery”. Taking delivery refers to the process of storing the physical commodity (obviously not an option for many traders). As the May 2020 futures contract expiration loomed there was a lack of demand and storage for physical oil which led to the unprecedented negative prices.
Lessons to be Learned
Though Crude Oil Futures are unlikely to go negative again any time soon, investors can learn a lot about markets by looking back at history with clear eyes. Below are 5 lessons investors can learn from the oil contagion incident of 2020:
1. Anything is Possible in Markets: “Black Swan” events tend to occur more than investors think.In the past 10 years, investors have witnessed Crude Oil Futures go negative, the flash crash of 2015, and the COVID-19 pandemic roil markets.
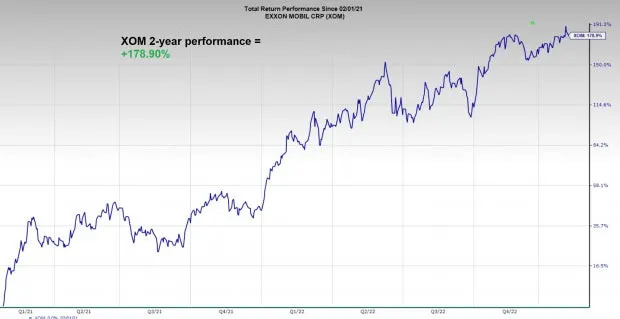
2. Crisis = Opportunity: A classic saying is, “It’s always darkest before dawn.” Whether it was the banking sector in 2009, Crude Oil in 2020, or the stock market post-pandemic, the stock market tends to offer its juiciest opportunities in what seem to be the darkest times. For example, related stocks such as Occidental Petroleum OXY, Exxon Mobil XOM, and Halliburton HAL have more than doubled over the past 2 years since crude oil went negative.

Zacks Investment Research
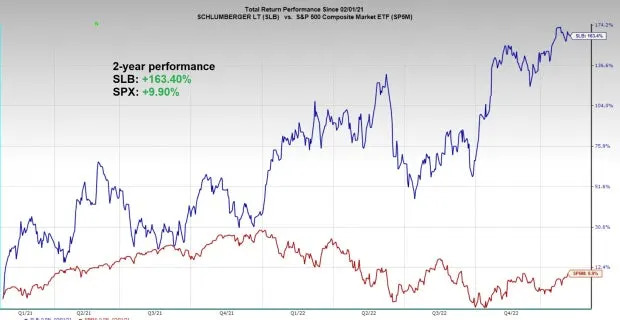
3. Extremes can Lead to Extremes in the Other Direction: When an asset class gets pulled to far in one direction, it often snaps back rapidly in the opposite direction. This concept is known as reversion to the mean. After being one of the weakest groups in 2020, energy stocks like Schlumberger SLB have flipped a switch and have become one of the strongest groups in the market over the past two years.

Zacks Investment Research
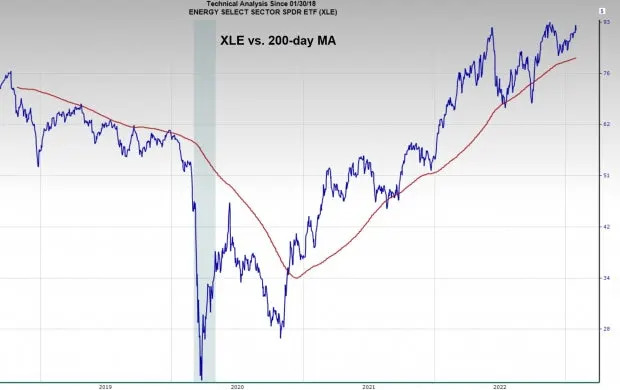
4. The Difference Between Tops and Bottoms: Major tops in stocks and commodities tend to take several months. On the other hand, major bottoms tend to occur over on day or a handful of days. Tops are a process; bottoms are an event.
A prime example of this phenomenon is the chart of the Energy Select Sector SPDR ETF XLE. Note how the 2009 and 2020 bottoms caused the trend to turn on a dime, while the topping process in 2014 took multiple years to gain momentum.

Zacks Investment Research


