Story by Bruce Kamich, TheStreet.com ~Every couple of minutes we are reminded of the price of crude oil (and the yield on the 2-Year and 10-Year Treasury and the direction of the U.S. dollar) by various financial media outlets. You cannot escape it and even if you do you are going to see the price of regular and hi-test gasoline on your next trip to the supermarket.
So, let’s check out the charts and indicators on crude oil and get ready for some “pain at the pump.”
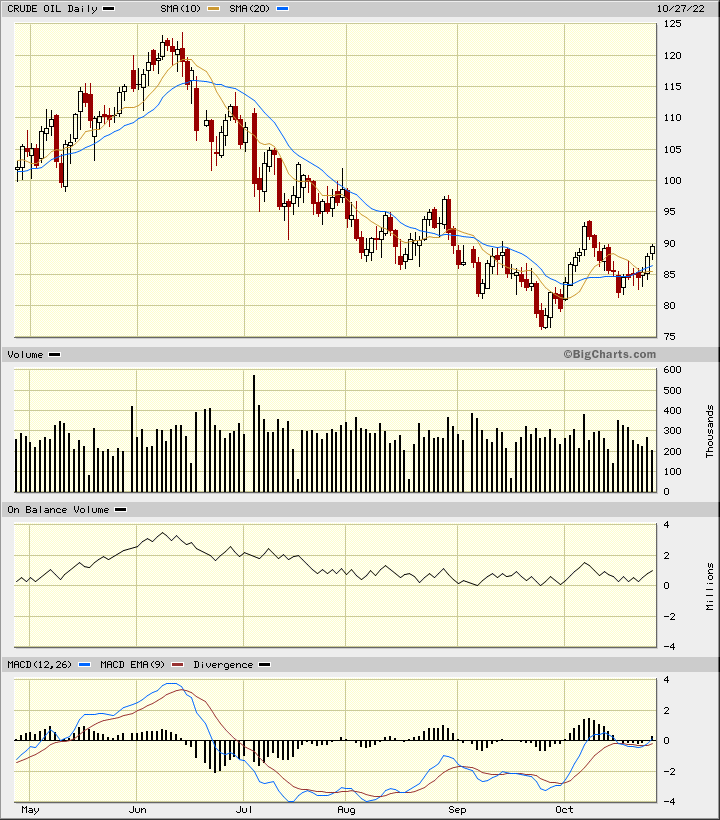
In the daily Japanese candlestick chart of the “continuous futures contract,” below, we can see that prices declined from early June to late September. They then rallied into early October and then made what I believe to be a successful retest of the late September low. Prices are now creeping higher and are trading above the 10-day and the 20-day moving average lines.
The daily On-Balance-Volume (OBV) line is turning higher and the Moving Average Convergence Divergence (MACD) oscillator is poised to move above the zero line for a new outright buy signal.


MINERAL OWNERS: LEASE OR SELL YOUR MINERAL RIGHTS IN OKLAHOMA OR TEXAS. START HERE. WE HAVE PRIVATE EQUITY FUNDS LOOKING FOR LEASES IN OKLAHOMA. CALL TO GET AN OFFER (405) 492-6277


